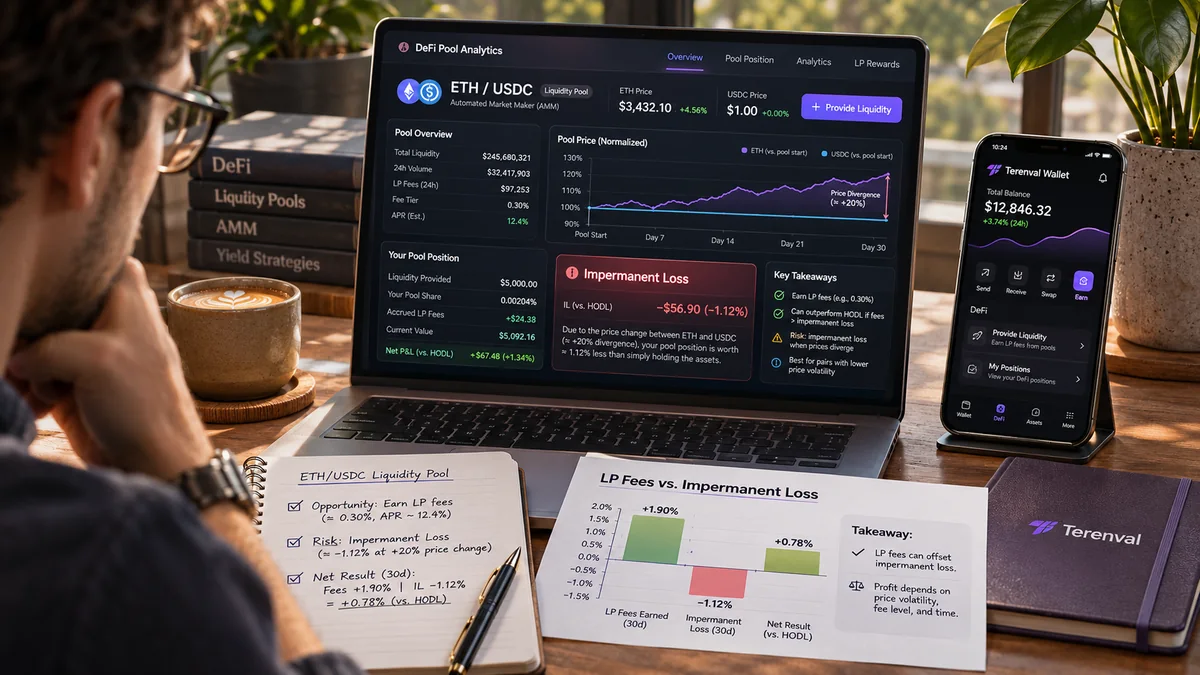
Impermanent loss (IL) is the amount by which a liquidity-provider position underperforms simply holding the same initial token quantities after the tokens' relative market prices change. It is often called divergence loss. It can occur even when the pool position rises in dollar value and even when the smart contract functions exactly as designed. Trading fees may compensate for IL, but they do not make it impossible. A position that looks attractive because of a high advertised APR can still finish behind an ordinary wallet holding the starting assets.
Consider a $10,000 ETH/USDC position that begins with 2 ETH worth $5,000 and 5,000 USDC when ETH costs $2,500. If ETH doubles to $5,000, the two untouched holdings would be worth $15,000. In a hypothetical fee-free, full-range constant-product pool, arbitrage-driven rebalancing leaves the position worth about $14,142, roughly $858 less than holding. Yet that is not a $858 loss from the original $10,000: the pool value is still above the starting investment. It is a loss of relative performance. This distinction changes how liquidity provision should be evaluated.
Short answer: Impermanent loss occurs because an automated market maker (AMM) automatically changes the quantities of two tokens a liquidity provider owns as their relative prices move. In a standard 50/50 constant-product pool without fees, the position becomes overweight the token that fell in relative price and underweight the token that rose. Its value is therefore lower than the value of holding the original token quantities at the same ending prices. The loss is not guaranteed to become a negative cash return, can shrink if the price ratio returns, and must be considered together with trading fees, transaction costs, contract risk and the ability to exit.
Terenval's editorial assessment: An LP position is not a savings deposit with a promotional interest rate; it is a continuously rebalanced inventory strategy that sells some of the asset rising in relative price and buys some of the asset falling in relative price. That behavior can be a reasonable choice for a user who wants market-making exposure, but it is a poor surprise for an investor who intended only to hold a rising token. To make the economics auditable rather than promotional, this guide introduces four original educational frameworks: the Terenval LP Outcome Ledger, Fee Coverage Ratio, Range Survival Stress Test, and Rebalance Decision Compass. These are analytical worksheets, not on-chain features of Uniswap or Terenval Wallet, automated safeguards, or profit guarantees.
Information cutoff: November 5, 2026. Protocol mechanics are based on the primary Uniswap documentation linked throughout. Every ETH price, fee amount, gas cost, annualized return and pool balance used below is a hypothetical teaching input, not a live quote, a historical backtest or a claim about current pool profitability. Actual pools have price paths, fees, liquidity competition and contract behavior that a simple example cannot reproduce.
Key Takeaways
- IL is relative to HODL. It compares the LP outcome with leaving the original assets untouched; it does not necessarily mean the portfolio lost dollars.
- The benchmark must use identical starting tokens. Comparing an ETH/USDC LP with a USDC-only bank-style deposit is a different investment comparison.
- The classic formula applies to a specific AMM design. The familiar
2 × sqrt(r) / (1 + r) − 1formula assumes a fee-free, 50/50 full-range constant-product exposure with consistent pricing. - Trading fees can offset divergence loss. Whether they do depends on actual fees attributable to the position, time in range, their token value and costs.
- LP fees are not simply pool volume × headline fee rate. Account for the active liquidity share, protocol fee shares, fee collection and any manager or hook fees.
- Uniswap v2 and concentrated liquidity behave differently. Standard v2 liquidity remains active across the positive price curve; v3 and standard v4 let users choose a narrower range.
- Out of range is not liquidation. An ordinary concentrated LP position stops earning new swap fees when the price exits its band and becomes one-sided, but an external lending position can introduce a separate liquidation risk.
- A narrow range changes the risk, not just the yield. Higher fee capture per dollar while active accompanies a greater chance of becoming one-sided and inactive.
- The 50/50 IL table cannot be copied onto every v3/v4 position. Range boundaries, starting token quantities and potentially v4 hook logic require position-specific calculations.
- Stablecoin/stablecoin is not risk-free. A depeg can leave LPs holding more of the impaired token, alongside direct USD value losses even when calculated relative IL looks modest.
- Rebalancing does not erase prior losses. Closing and reopening a position changes inventories and sets a new comparison starting point; it incurs execution costs.
- Fees displayed as APR or APY may be backward-looking and misleading. Returns vary with trade volume, active liquidity, incentives, protocol settings and the time window used.
- Token permission is a separate security issue. Approving an ERC-20 spender or signing an authorization is not the same as connecting a wallet.
- Terenval Wallet is not represented here as a built-in LP manager. The self-custody discussion is about independent control of keys, networks and approvals, not an undocumented DeFi integration.
What is impermanent loss in a DeFi liquidity pool?
Impermanent loss is a relative valuation effect caused by changing token inventories inside an AMM. The usual comparison is between two hypothetical outcomes evaluated at exactly the same moment and market prices:
- Hold-only outcome: Keep the original token units in your wallet without trading, lending, rebalancing or earning LP fees.
- Liquidity-provider outcome: Deposit the initial tokens into a specified pool, let the AMM execute its pricing and swaps, and value the resulting claim on assets at the same endpoint.
The difference between them, before fees and costs, is the divergence result. For the standard 50/50 constant-product case, a moving relative price produces a negative divergence result; the pool does not need to be hacked. The Uniswap v2 returns documentation explicitly derives the relative-loss formula, while Uniswap's overview explains the underlying market-making mechanism.
Why does the loss happen if no one steals the tokens?
The pool offers traders an exchange rate determined by its reserves and pricing rules. When the wider market price changes, traders and arbitrageurs can exchange tokens with the pool until its marginal exchange rate aligns more closely with external prices, subject to fees and execution conditions. These trades change the relative quantities held by the pool. A liquidity provider owns a claim on that changing inventory rather than a fixed number of both original tokens.
If ETH appreciates against USDC, the pool typically distributes ETH to traders and accumulates USDC. Your claim holds less ETH than you would have held privately. If ETH falls, the pool typically accumulates ETH as traders exchange ETH for USDC. Your claim holds more ETH and less USDC than a hold-only wallet. Neither direction is inherently fraudulent; both are consequences of passive market making.
Is impermanent loss the same as losing your principal?
No. A pool position can rise from $10,000 to $14,142 and still exhibit a roughly $858 impermanent loss versus a $15,000 hold-only benchmark. Conversely, a position can fall to $7,071, represent a genuine mark-to-market decline of approximately $2,929 from the starting value, and also underperform its hold-only benchmark by roughly $429. One number measures absolute loss; the other measures relative performance.
Fees, incentives and exit expenses produce still more distinctions. Avoid the common error of calling every dollar of reduced HODL performance a separate bank-account-style withdrawal. IL reflects what you did not earn because your tokens were rebalanced by the pool.
Why is it called “impermanent” if a user can lose money for good?
The label describes the possibility that the difference relative to holding shrinks or returns to zero if the relative price ratio returns to its entry level, under the simplified model and before costs. Nothing obliges prices to return. Once you remove liquidity and exchange or sell the returned tokens, the inventory exposure and comparative result at that point are effectively locked in for that strategy. Even if the market later reverses, the closed position will not automatically recover.
That is why divergence loss is sometimes a clearer term. “Impermanent” should not be interpreted as temporary until refunded or covered by the protocol. There is no insurance built into the AMM equation.
How does an automated market maker create impermanent loss?
A conventional limit-order market relies on bids and asks that traders or market makers submit. A constant-product AMM uses reserves to quote marginal exchange rates under a mathematical invariant. The original Uniswap v2-style mechanism is written as:
x × y = k
Here x is one token's reserve, y is the other token's reserve, and k is the reserve product for the fee-free idealization during a swap. With trading fees, the effective reserve product can grow; real quotes also depend on input fees, rounding, existing pool liquidity and other protocol parameters. In a market repricing, traders change x and y through swaps. Under the idealized invariant and an external token1-per-token0 price P, the reserves adjust so that y / x moves with P.
A 50/50 pool in a real-looking example
Suppose ETH costs $2,500, and the illustrative pool position represents 2 ETH and 5,000 USDC. Both tokens have the same initial dollar value. In an ideal full-range, fee-free pool, after the ETH/USDC price ratio moves by factor r, the LP's inventory is:
ETH in position   = 2 / sqrt(r)
USDC in position  = 5,000 × sqrt(r)
ETH price         = $2,500 × r
If the price doubles (r = 2), the LP holds approximately 1.4142 ETH and 7,071.07 USDC. A wallet that simply held the starting tokens still holds 2 ETH and 5,000 USDC. Both portfolios are valued at the new $5,000-per-ETH market price, so their difference can be compared without inventing different exchange rates or a price advantage for one strategy.
The role of arbitrage and informed trading
The rebalancing is not usually triggered by a single timer or a centralized manager. It is produced by economically motivated swaps. When an external market moves first, arbitrageurs may trade against a stale on-chain price and capture part of the difference; LPs then effectively trade at prices that lag the change. This is an additional market-making concept called adverse selection, often discussed through loss-versus-rebalancing (LVR). It is related to IL but not the same metric: LVR compares with a continuously rebalanced reference strategy along the price path, while conventional IL compares endpoint LP value with holding the initial tokens. Adding an LVR estimate to IL without aligning benchmarks can double-count effects.
An LP can earn enough transaction fees to compensate for its exposure in some market conditions. It is not correct to assume every arbitrage transaction is harmful or every high-volume day is automatically profitable. The economics depend on why trading occurred, what fees were paid, the effective execution prices and the LP's active share of the pool.
Impermanent loss formula: how to calculate it correctly
For a fee-free 50/50 full-range constant-product pair with token1 as a stable unit of account, define:
r = ending price of token0 / starting price of token0

Impermanent loss as a fraction of HODL value:
IL(r) = 2 × sqrt(r) / (1 + r) − 1

Impermanent loss percentage = IL(r) × 100%
This is the formula given in Uniswap's developer documentation. It does not estimate how much cash was stolen, how far the LP fell from its initial principal, annual APY, fee income or the return on a concentrated range. Both percentage and time horizon matter; the equation is an endpoint function of the relative price ratio, not a prediction of future prices.
Deriving the formula in three transparent steps
At entry, if each token contributes half the initial portfolio value V0, the hold-only portfolio at a new price ratio r is worth:
V_HODL(r) = V0 × (1 + r) / 2
The fee-free constant-product AMM adjusts inventories in inverse proportion to the square root of the price ratio. Its marked-to-market value becomes:
V_LP(r) = V0 × sqrt(r)
Divide the pool value by the HODL value, then subtract one:
(V_LP / V_HODL) − 1
= [V0 × sqrt(r)] / [V0 × (1 + r) / 2] − 1
= 2 × sqrt(r) / (1 + r) − 1
The initial V0 cancels, which is why the percentage IL is identical for a $1,000 or $1 million hypothetical position with the same pair, relative-price move and AMM assumptions. The dollar opportunity cost differs with the investment size. Fee income and absolute risk also differ.
Impermanent loss table for a $10,000 ETH/USDC position
Assumptions: 2 ETH at an initial $2,500 each plus 5,000 USDC; USDC stays at $1; fees, slippage, taxes and gas are ignored; ETH is the only moving price; constant-product full range with no external liquidity effects on the fractional position. Dollar values are rounded to cents.
| ETH price change | ETH price | LP ETH | LP USDC | HODL value | LP value before fees | IL vs HODL | IL (%) |
|---|---|---|---|---|---|---|---|
| -75% | $625 | 4.0000 | $2,500.00 | $6,250.00 | $5,000.00 | −$1,250.00 | -20.00% |
| -50% | $1,250 | 2.8284 | $3,535.53 | $7,500.00 | $7,071.07 | −$428.93 | -5.72% |
| -25% | $1,875 | 2.3094 | $4,330.13 | $8,750.00 | $8,660.25 | −$89.75 | -1.03% |
| +0% | $2,500 | 2.0000 | $5,000.00 | $10,000.00 | $10,000.00 | $0.00 | +0.00% |
| +25% | $3,125 | 1.7889 | $5,590.17 | $11,250.00 | $11,180.34 | −$69.66 | -0.62% |
| +50% | $3,750 | 1.6330 | $6,123.72 | $12,500.00 | $12,247.45 | −$252.55 | -2.02% |
| +100% | $5,000 | 1.4142 | $7,071.07 | $15,000.00 | $14,142.14 | −$857.86 | -5.72% |
| +200% | $7,500 | 1.1547 | $8,660.25 | $20,000.00 | $17,320.51 | −$2,679.49 | -13.40% |
Interpretation: The $858 deficit when ETH doubles is 5.72% of the $15,000 hold-only value, not 5.72% of the initial $10,000. When ETH halves, the percentage IL is also approximately 5.72% of the ending hold-only value (then $7,500), making the relative shortfall about $429. Symmetry here is between a price doubling and halving under the formula, not symmetry of cash P&L from the starting investment.
What changes when both tokens fluctuate against the dollar?
The formula depends on their price ratio, not one symbol's USD price alone. In an ETH/BTC pool, suppose ETH and BTC both double in USD while their ratio stays constant. The simplified model implies zero IL relative to holding ETH and BTC, even though both portfolios appreciate in dollars. If ETH rises by 50% while BTC rises by only 25%, the relevant ratio is 1.50 / 1.25 = 1.20, not 1.50. Picking a wrong base currency is a frequent source of misleading “calculator” screenshots.
For USDC/USDT or another stable/stable pair, the ratio may appear close to 1 for long periods, but this does not make the position dollar-risk-free. If one stablecoin breaks its peg, both the relative ratio and the mark-to-market purchasing power of the inventories can deteriorate. The theoretical IL percentage alone is not a complete risk measure.
Worked example: ETH doubles and the liquidity pool still makes money
Return to the same $10,000 starting position with 2 ETH and 5,000 USDC. At an illustrative $5,000 ETH price, compare three numbers:
| Measure | Value | What it answers |
|---|---|---|
| Starting principal | $10,000.00 | How much was initially contributed? |
| Hold-only portfolio | $15,000.00 | What if the exact entry tokens had stayed in the wallet? |
| LP inventory without fees | $14,142.14 | What would the AMM-held inventories be worth? |
| Divergence deficit | −$857.86 | How much value was given up versus HODL? |
| Absolute LP gain before fees | +$4,142.14 | Did the LP position rise from its starting dollar value? |
Both “the LP made $4,142” and “the LP underperformed HODL by $858” can be true at the same time. A financial statement that reports only one of these numbers hides the investor's opportunity cost or overstates the risk, depending on what was omitted.
Add the actual economic effects of earning fees
Now assume the position earned $650 of swap fees, valued in USD at the endpoint, and $55 of total network, execution and position-management costs. Assume there were no extra incentives, no accounting complications and no token-price change between earning and valuing those fees. This is an intentionally simplified isolated example:
LP inventory at exit               $14,142.14
+ earned fees                          $650.00
− cumulative costs                      $55.00
= net LP outcome                    $14,737.14

Hold-only outcome                   $15,000.00
Net LP advantage versus HODL          −$262.86
The LP generated positive fee income and a positive dollar return but still lagged holding by about $263. If, with all other assumptions unchanged, fees had totaled $1,000, the LP would have finished around $87 ahead of HODL. Fee income can defeat the opportunity cost; a marketing APR does not prove that it did.
How many trading fees are needed to break even against HODL?
The correct break-even target in this simplified comparison is the absolute dollar divergence shortfall plus all incremental LP costs:
Required net fees to match HODL
= max(0, V_HODL − V_LP_before_fees) + incremental LP costs

At ETH ×2: $857.86 + $55.00 = $912.86
The example does not predict how long it will take to earn $912.86. Fee rates, realized volumes, active liquidity competition and pool versions determine the path. Liquidity incentives can improve the cash-flow picture but introduce token price and sustainability risks. If the LP would incur different custody, exchange or execution costs when merely holding, the comparison should use incremental, not total, costs on each side.
Could a trader really collect $650 in fees?
It is a hypothetical amount, not a statement about any current ETH/USDC pool. In practice you must obtain fees attributable to the specific position, after any applicable protocol or vault manager allocation, priced in their actual tokens and covering the same period as the price performance. An LP owning 0.01% of effective active liquidity does not receive the same fees as one providing 10%. More raw trading volume is not enough to infer income; the position must be in range where relevant.
The Terenval LP Outcome Ledger: four balances every LP should track
To avoid confusing a headline APR with real wealth creation, we propose an educational four-balance statement. This is our editorial accounting framework, not a standardized reporting method endorsed by a protocol.
| Ledger | What to measure | What question it resolves |
|---|---|---|
| 1. Entry inventory | Original exact token units, price ratio, USD values, timestamp | What are we comparing against? |
| 2. HODL benchmark | Current value of those same original token units, with any separately specified passive yields | Would not trading have worked better? |
| 3. LP inventory | Current token quantities and USD price of the pool claim, excluding uncollected fees if tracked separately | What did AMM rebalancing do? |
| 4. Cash-flow and exit adjustments | Fees owed or collected, incentive tokens, gas, swaps, taxes if applicable, manager/hook fees | What is the investable result after getting out? |
The simplest properly disclosed relative-profit calculation is:
LP net wealth = LP inventory market value
+uncollected fees at realizable token prices
+separately collected fees still held
+realizable incentive value
−incremental transaction and management costs
HODL wealth = initial token A units × current token A price
+initial token B units × current token B price
−applicable HODL-only costs, if any
LP excess value = LP net wealth − HODL wealth
Do not double-count fees. In Uniswap v2, fees are generally incorporated into reserves and affect the value of pool shares, while in v3/v4 fee balances are accounted for separately until collected. The current documentation also describes protocol fee sharing for applicable versions and pools; check the actual pool settings rather than assigning the full displayed swap charge to LPs. Uniswap's current fee documentation distinguishes these mechanics.
When the initial holdings are not exactly 50/50
The standard percentage formula presumes an initially balanced full-range pair under the usual model. A concentrated position might start with more USDC than ETH, or be deposited entirely as one token near or outside a range. Its correct comparison uses those exact entry token quantities. A headline “IL at +50% ETH” taken from a generic 50/50 table can badly misrepresent a one-sided or narrow-range position.
Time-weighted deposits and withdrawals
If you add capital mid-period, remove part of a position, collect and spend fees, or automatically compound them, the naive beginning-versus-end portfolio comparison will be distorted. Use a transaction-level ledger or a cash-flow-adjusted return measurement and reset or split benchmark cohorts when new capital enters. This is especially important for vaults and auto-rebalancing strategies whose token mix changes repeatedly.
Uniswap v2, v3 and v4: why the version changes the risk
Liquidity provision is not a single universal product. The Uniswap Liquidity Overview describes how v2, v3 and v4 positions differ in liquidity placement, fees and lifecycle actions.
| Question | Uniswap v2 full-range | Uniswap v3 concentrated | Standard Uniswap v4 concentrated |
|---|---|---|---|
| Liquidity placement | Across the whole positive price curve | User-selected tick-bounded range or full range | User-selected range; pool may also have custom hook |
| Positions active if market leaves a chosen band? | No custom band; full-range position remains active | No: out-of-range position stops earning new swap fees | No for standard concentrated liquidity; custom hook rules require inspection |
| Fee accounting | Fees incorporated into reserves; current protocol split may apply | Fees accrued to individual position; not auto-compounded | Position fees accounted separately; dynamic fees and hooks possible |
| Position exposure | Continuously changing two-token balance | Can become one-sided at either range boundary | Same basic concentrated behavior unless modified by a hook |
| Most important extra question | Is fee income sufficient relative to HODL? | Will the chosen band survive likely price moves and be economical to maintain? | What exact hook, fee behavior, permissions and external dependencies does this pool introduce? |
The basic full-range constant-product formula is a useful first lesson, but not a universal simulator of v3/v4. It also does not directly simulate stable-swap curves, weighted pools, custom invariants, strategy vaults or leveraged LP tokens.
Uniswap v2: wide exposure, continuous participation
A conventional v2 pool maintains passive liquidity across all strictly positive price ratios. It does not go “out of range” in the concentrated-liquidity sense. That does not make it safe: very large price divergence can produce substantial opportunity cost and, if one asset collapses toward zero, the pool can end up heavily concentrated in the impaired token. Fees may offset some of that exposure but do not guarantee principal protection.
For a live v2 pool, separate the total fee charged to traders from the part ultimately attributable to LPs; current Uniswap documentation identifies protocol-fee arrangements that can split the historical 0.30% swap charge. Using the full 0.30% as an LP profit estimate without checking the applicable setting would overstate income.
Uniswap v3: selecting a price range adds directional exposure
In v3, you select a lower price and an upper price for which your liquidity is active. Concentrating capital can improve fee capture while the position remains in range compared with spreading the same capital across prices where almost no swaps occur. But the range also changes inventory more rapidly as the price approaches its limits. If ETH falls below the lower limit in an ETH/USDC example, the position is generally held entirely as ETH; if ETH rises above the upper limit, it is held entirely as USDC, given the price convention used here.
The Uniswap support explanation is explicit: exiting a range is not itself a lending-style liquidation. The LP position becomes single-sided and stops accruing new swap fees until the price re-enters the range. If the price returns, fee accrual can resume, but the previous economics and transaction costs are not retroactively erased.
Uniswap v4: hooks and fee customization add another layer
Uniswap v4 uses concentrated liquidity but allows optional hooks, external pool-specific code that can change behavior around swaps and liquidity changes. A hook can adjust dynamic fees, implement custom accounting or create external dependencies. Some pools use no hook; others are materially different products even if a dashboard uses familiar ETH/USDC symbols. The official v4 hooks overview and security framework explain these possibilities and their risk surfaces.
As a rule, do not assume a pool called “Uniswap v4” is equivalent to a hook-free v3 pool. Inspect the pool key, optional hook contract, who can update settings, fee logic, token behavior, audits, whether assets can leave the pool and how a position is actually removed. The original constant-product IL formula may be an inadequate model for custom curves or additional external exposures.
Concentrated liquidity: a $10,000 example with actual range math
Generic IL tables often conceal the biggest economic difference in modern AMMs: inventory conversion at the edges of a price range. We can calculate this explicitly with a hypothetical standard concentrated-liquidity position, without using a live protocol quote.
Assume an ETH/USDC position initialized at ETH = $2,500, active only between $2,000 and $3,000. Let token0 be ETH and token1 be USDC, with price P = USDC per ETH. Choose the liquidity amount L so that the initial marked inventory equals $10,000. This range is not symmetric in the square-root-price domain. Therefore, the starting portfolio is not exactly 50/50 ETH/USDC. This is why we must compare against its actual initial inventory rather than reuse the v2 table.
For a standard concentrated position, the inventory in the active range is:
When Pa < P < Pb:
ETH(P)  = L × [1 / sqrt(P) − 1 / sqrt(Pb)]
USDC(P) = L × [sqrt(P) − sqrt(Pa)]

When P <= Pa:
ETH(P)  = L × [1 / sqrt(Pa) − 1 / sqrt(Pb)]
USDC(P) = 0

When P >= Pb:
ETH(P)  = 0
USDC(P) = L × [sqrt(Pb) − sqrt(Pa)]
Here Pa = 2000, Pb = 3000 and P0 = 2500. Solving the $10,000 entry value gives L ≈ 1,037.8726. The opening position is 1.8086 ETH plus 5,478.56 USDC, not 2 ETH plus 5,000 USDC. The following table values are before fees, rewards, price impact, gas and taxes.
| ETH price | Position state | LP ETH | LP USDC | LP value | Same-entry HODL value | Relative deficit | IL vs HODL |
|---|---|---|---|---|---|---|---|
| $1,250 | Below range | 4.2587 | $0.00 | $5,323.33 | $7,739.28 | −$2,415.95 | -31.22% |
| $1,800 | Below range | 4.2587 | $0.00 | $7,665.59 | $8,734.00 | −$1,068.40 | -12.23% |
| $2,000 | At lower bound | 4.2587 | $0.00 | $8,517.32 | $9,095.71 | −$578.39 | -6.36% |
| $2,250 | In range | 2.9314 | $2,815.55 | $9,411.20 | $9,547.86 | −$136.66 | -1.43% |
| $2,500 | In range | 1.8086 | $5,478.56 | $10,000.00 | $10,000.00 | $0.00 | +0.00% |
| $2,750 | In range | 0.8426 | $8,011.42 | $10,328.52 | $10,452.14 | −$123.63 | -1.18% |
| $3,000 | At upper bound | 0.0000 | $10,431.55 | $10,431.55 | $10,904.29 | −$472.74 | -4.34% |
| $3,500 | Above range | 0.0000 | $10,431.55 | $10,431.55 | $11,808.58 | −$1,377.03 | -11.66% |
| $5,000 | Above range | 0.0000 | $10,431.55 | $10,431.55 | $14,521.44 | −$4,089.89 | -28.16% |
What the table demonstrates: A move from $2,500 to $3,500 leaves this concentrated position completely in USDC at a position value near $10,431.55, while its untouched entry tokens would be worth about $11,808.58. The relative shortfall is about $1,377.03, or 11.66% of HODL value—very different from a generic full-range 50/50 result for a 40% price rise. A move below $2,000 makes the position one-sided in ETH. Its value can then keep falling with ETH even without new swaps in the inactive position.
Is the capital lost when the range is breached?
No automatic liquidation or disappearance occurs in an ordinary unleveraged Uniswap v3/v4 concentrated position. Rather, the inventory reaches a single-token boundary and becomes inactive for fee earning. The remaining asset still has a market price, and the owner can generally close the position subject to smart-contract functionality, gas and any constraints imposed by external wrappers or vaults. A separate lending position that uses LP exposure as collateral can, however, be liquidated under its own protocol rules.
Does selecting a narrower range always increase profits?
No. Narrower placement may raise the position's share of fee-earning liquidity while it is active, but it also increases the probability of leaving the range and can intensify divergence relative to holding. Fees are path-dependent; the final price alone does not tell us how much active trading occurred or how many rebalances were needed. A $10,000 position with a 5% range can yield less net income than a broader position if it spends most of its life inactive and incurs repeated execution charges.
Are full-range v3 and v2 mathematically identical investments?
They can share the same underlying 50/50 divergence exposure under idealized price-only assumptions, but their fee tiers, fee accounting, active liquidity competition, collection mechanisms and protocol-fee configuration differ. This matters for the cash outcome. Uniswap's research on liquidity-provider fees studies fee differences and distinguishes fee returns from capital returns. A fee-rate comparison is not a complete return comparison.
What pays a liquidity provider: where fee income really comes from
Liquidity providers are paid primarily because traders use the liquidity offered by their positions. A swap typically charges a fee that is allocated under the pool's fee rules. In a pool with concentrated liquidity, the relevant fraction of trading flow belongs to active positions at the current price, not necessarily every account shown in a dashboard's total TVL.
An illustrative fee attribution equation is:
LP fee income for a period
≈ Sum over eligible swaps of
  [swap notional × LP-attributable fee rate × position share of active liquidity]
The actual on-chain math and fee accounting depend on the protocol version, tokens, tick crossings, protocol-fee settings and hook behavior. The equation is a reasoning aid, not an exact replacement for reading fee-growth variables or accounting records.
Example: high trading volume does not equal your income
Suppose a pool processes an illustrative $5 million in swaps during one month, with a 0.30% headline swap fee. That produces $15,000 of gross swap charges, not $15,000 of income for each LP. If the applicable protocol fee is 0.05 percentage points of swap notional, the portion attributable to LPs would be $12,500 before further complications. A position capturing 1% of applicable active liquidity across the relevant swaps might receive about $125. If it is out of range for most of the period, a naive 1% share of the pool's average TVL is not enough to estimate the actual accrued amount. These numbers are an illustrative calculation, not a quoted Uniswap pool fee or return.
APR versus APY in a liquidity-pool dashboard
APR is a simple annualized rate if the measured earnings rate persisted; APY incorporates a compounding assumption. Suppose an LP earns $70 in fees on a $10,000 position in seven days. A simple annualization yields ($70/$10,000) × (365/7) ≈ 36.5% before IL and costs. That result does not mean the user has a guaranteed 36.5% annual income, especially if the seven days coincided with a rare volume spike. Nor does a position automatically compound if its accrued fees remain separately claimable.
Uniswap v3 and v4 accrued fees are not automatically added to the liquidity position; fee claiming and reinvestment have their own transactions or strategy rules. The official liquidity guide explains that distinction. A vault advertising compounded APY may take management fees, change ranges and create additional smart-contract exposure.
Rewards, bribes and token incentives
Some protocols or managers supplement trading fees with emissions or incentives. They can improve a quoted APR but are not the same as organic trade demand. Rewards may be denominated in a volatile token, subject to vesting, end abruptly or become difficult to sell without slippage. Report them separately in the outcome ledger. A $100 notional incentive at the time it is awarded is not guaranteed to be worth $100 at exit.
The Terenval Fee Coverage Ratio: can earned fees compensate for divergence?
The second original educational model, the Fee Coverage Ratio (FCR), compares realizable cumulative benefits with the observed relative divergence shortfall and LP-only costs over the same period:
FCR = (realizable earned fees + realizable incentives)
      / (positive divergence shortfall + incremental LP costs)
Interpretation for the specific benchmark and timestamp:
- FCR below 1: recorded benefits do not yet cover modeled relative underperformance and costs.
- FCR equal to 1: near break-even versus the specified HODL benchmark under the stated assumptions.
- FCR above 1: fees and incentives appear sufficient for this snapshot; future prices and costs can change the conclusion.
- Denominator zero: the ratio is undefined or not informative; report absolute net profit instead of claiming an infinite safe return.
For the doubling-ETH scenario, using $650 in fees, $857.86 in relative shortfall and $55 in costs gives FCR = 650 / (857.86 + 55) ≈ 0.71. The investor captured roughly 71% of what would have been required to eliminate the identified relative deficit. A new price move, change in rewards or liquidity exit would change this measurement.
Limitation: FCR is a historical economic check, not a risk indicator, trading signal or hedge against theft. It can be greater than 1 immediately before a bad asset depeg or smart-contract loss. It also does not apply as a one-size-fits-all metric when benchmark inventory, deposits or reporting period change without adjustment.
Stablecoin liquidity pools: low displayed IL is not the same as low risk
A liquidity provider might infer that an USDC/USDT or DAI/USDC pair is safe because both coins are intended to trade near $1. Under normal conditions, relative-price changes may indeed be smaller than in ETH/USDC. But the tail risks are different, not absent. If one asset loses its peg, an AMM can accumulate the impaired token as arbitrage activity drains the stronger one from the pool.
A 5% depeg can look modest in the IL formula
For a hypothetical standard 50/50 constant-product pool, a relative price ratio changing to r = 0.95 creates classic IL of only about −0.0329% versus holding the two original tokens. That small relative number is not the total loss of wealth measured in dollars. A hold-only portfolio initially split between two $1 assets is now itself worth less than at entry, because half the units belong to the depreciating asset. The AMM effect is an additional shortfall relative to that already damaged benchmark.
This calculation is not a projection for specialized stable-swap curves. Different invariants can maintain a tight quote near parity and behave very differently under extreme depegs. It is also not proof that a 5% depeg always causes only a 0.0329% LP loss.
Failure modes a stablecoin pair needs to survive
- Reserve and issuer risk: The token may not be redeemable at the assumed price, or redemption may be restricted by jurisdiction, banking access or issuer action.
- Liquidity and slippage: On-chain volume may be high because users are rushing away from the impaired asset, not because the strategy is earning healthy repeatable income.
- Correlated claims: Tokens marketed as separate stablecoins can share banking, custody, bridge or collateral dependencies.
- Pool design: The stable-swap invariant, peg assumptions, oracle dependence and emergency parameters can change the outcome from the vanilla formula.
- Vault and bridge layers: An LP token wrapped into another yield product introduces a second or third layer of execution and redemption risk.
Terenval's editorial view: For a stablecoin pool, the critical question is not “How small is IL at a 1% move?” but “What token inventory will I own if one of the promises of redemption fails?” Run a stress test that treats a depeg as persistent and potentially unrecoverable, then test whether there remains an exit market.
The Terenval Range Survival Stress Test
A high displayed fee APR in a concentrated position is most meaningful if the position remains active long enough to earn it. The third original framework is the Range Survival Stress Test, which asks how the position behaves across price paths, not simply at a final quote.
Step 1: establish measurable assumptions
Record the current price, exact lower and upper ticks, initial token quantities, period of observation, expected net fee capture, time-in-range, available gas budget and specific rule for managing a breach. You can use historical volatility for a range of scenarios, but it is not a guarantee of future behavior. Do not treat a daily candle close as evidence that the price never moved outside the range intraday.
Step 2: test contrasting trajectories
| Scenario | Possible LP outcome | Decision question |
|---|---|---|
| Price stays near the center of the range | Two-sided liquidity remains active; trading fees may accrue | Are fees sufficient after costs and adverse selection? |
| ETH rises fast through upper bound | Position shifts toward USDC, loses further ETH upside and stops earning fees | Do you accept being sold out of ETH at that band? |
| ETH falls sharply below lower bound | Position shifts toward ETH and stops earning fees | Do you accept accumulating the declining token? |
| Price exits then returns | Fee accrual pauses, then may resume if position remains open | Can you tolerate downtime without unnecessary trades? |
| Price oscillates violently inside the range | Higher volume might earn fees, but traders may extract more value and costs can rise | Is fee quality better than market-making loss? |
| Wallet transaction costs spike | Small adjustments become uneconomical | Can you exit without relying on a fragile profit assumption? |
| Pool token or hook fails | Loss can exceed modeled IL | What is the independent security and failure plan? |
Step 3: calculate an in-range estimate with humility
A useful statistic is observed or hypothetical in-range time as a percentage of the period, but it is not itself a yield estimate. Sixty percent of time in range does not imply sixty percent of possible fees: a large fraction of trading may occur during the other forty percent, or the effective liquidity share may change. Use actual fee-growth observations for a real position when available.
Step 4: specify action triggers before they occur
Examples include “review if price nears 10% of a boundary,” “withdraw if an underlying stablecoin suspends redemptions,” or “do not rebalance if expected additional fees fail to exceed gas and slippage.” These are example policy rules, not universally safe thresholds. Avoid giving a dashboard or automated strategy unrestricted spending permission just to avoid checking the position manually.
The Terenval Rebalance Decision Compass: when to stay, move or exit
A user seeing an out-of-range alert may assume they must instantly rebalance. That is not generally true. Rebalancing changes the investment. It may be appropriate for a deliberate market-making strategy, but it can repeatedly sell assets that are rising, buy those that are falling or pay substantial transaction fees.
Our original Rebalance Decision Compass compares four choices:
| Choice | Why someone might choose it | Main tradeoff |
|---|---|---|
| Keep the position unchanged | Preserve the existing range and avoid new trades while waiting for possible re-entry | May remain inactive indefinitely and one-sided |
| Widen or relocate the range | Align liquidity with a new price environment and seek new trading fees | Changes token inventories; costs gas/slippage and creates a new benchmark |
| Partially withdraw | Reduce the amount exposed to the pool, retaining some optional future fees | New asset split and costs; partial exposure remains |
| Fully withdraw and hold | End the market-making activity and regain direct token balances | Realizes the current inventory outcome and gives up future LP fees |
The decision starts with the purpose of the original trade. If the investor's goal was to accumulate ETH, an LP position that sold ETH into a rally may be doing the opposite. If the goal was to actively quote swaps and earn compensation for inventory risk, then planned range adjustments might fit. But neither objective can be determined from the percentage APR in a screenshot.
Why “just rebalance back into range” can be misleading
Suppose a position becomes all USDC above the upper boundary. To open a new two-sided ETH/USDC band around the now-higher price, the LP will likely need to buy ETH at the higher price. If the market then falls, this can compound underperformance. Similarly, a below-range position may require selling ETH after a large drop in order to restore a two-sided balance. That is not necessarily irrational, but it is a new discretionary allocation, not an automatic fix for old IL.
Rebalancing, compounding and wash-style performance reporting
Some strategies reset performance charts each time a position moves. That can make every individual new range appear profitable while hiding losses incurred to fund the previous reset. For a fair long-term report, carry forward all deposits, withdrawals, swaps, performance fees, manager fees, gas and incentive conversions. Report strategy-level, not merely position-ID-level, outcomes.
Can you avoid or reduce impermanent loss?
You generally cannot eliminate divergence risk while supplying ordinary volatile-asset liquidity under the original constant-product model. You can change which risks you take, or buy protection whose price and failure risk must be counted. Practical tactics change the payoff profile rather than repeal the pricing invariant.
Match the pair to your market view
If you want to preserve ETH upside, compare an ETH/USDC LP with simply holding ETH plus USDC. If your investment thesis is that two assets will continue to move almost proportionally, a correlated pair may have less relative divergence, but correlation can collapse. A wrapped or staking derivative may add issuer, peg or redemption risk. Choosing two tokens with similar logos or “blue chip” labels is not a hedge.
Choose an appropriate concentration level
A broad v3/v4 price range can reduce how often a position becomes one-sided and inactive; narrower ranges are more sensitive to price moves and can require active management. Neither is universally best. Some investors deliberately prefer one-sided conversion at a range boundary as a type of range-order behavior, but that should be recognized as a trading objective, not marketed as risk-free yield.
Do not confuse insurance with a different strategy
Options, futures and delta-neutral market-making strategies may offset some price sensitivity or inventory divergence but introduce funding, option premiums, margin liquidation, basis, custody, counterparty and model risks. A “hedged yield farm” can lose money if the hedge fails exactly when fees or liquidity disappear. Demand a complete, auditable balance sheet rather than a single projected APY.
Keep operational exposure deliberately small
Using only money that can withstand substantial loss, checking contract identity, keeping fee tokens for exit gas, avoiding unknown hooks and verifying token approvals does not mathematically reduce IL. It does reduce unrelated ways a position can fail. Those protections matter because real LP outcomes are not limited to the neat formula.
When impermanent loss is not the main risk
A complete LP risk assessment distinguishes the market-making trade from other threats. The Uniswap support risk guide enumerates contract vulnerabilities, out-of-range positions, token risks and volatility. These should never be collapsed into one “IL percentage.”
| Risk | What happens | Is it the classic IL formula? |
|---|---|---|
| Divergence / impermanent loss | Pool inventory underperforms entry-token HODL after relative-price moves | Yes, for applicable AMM assumptions |
| Token rug pull or collapse | One asset loses most or all economic value | No; absolute principal and issuer risk may dominate |
| Smart-contract exploit | Assets may be stolen or rendered inaccessible | No |
| v4 malicious or faulty hook | Custom logic alters pricing, custody, fees or withdrawals unexpectedly | No |
| Price manipulation / MEV | Arbitrage and trade ordering may transfer value away from LPs | Related market-making risk but not simply endpoint IL |
| Gas and execution costs | Position creation, fee collection, swaps and exit reduce value | No |
| Stablecoin depeg | A supposedly stable asset trades below redemption or dollar parity | Not by itself |
| Leverage / collateral liquidation | Separate lending system forcibly sells or seizes collateral | No |
| Withdrawal restrictions in a vault | Manager or bridge dependency delays/blocks redemption | No |
| Lost key or malicious token approval | Attacker gains authorization or assets become inaccessible | No |
Why permissionless pools require token verification
Anyone may create a pool for a token symbol that resembles a familiar asset. A spoofed token, tax-on-transfer contract, blacklist feature or malicious hook can make the position economically different from the one displayed by a promotional banner. Verify the actual chain and token contract addresses, the pool key, hook or manager contracts, and documentation from independent sources. Token names and ticker symbols are not unique identifiers.
Why an audit does not eliminate economic risk
Contract audits can identify certain implementation bugs but do not guarantee liquidity, sound token economics, honest governance or a profitable market-making strategy. A correct contract can do exactly what it is designed to do and still create enormous losses when one token fails. Conversely, a favorable historic IL chart cannot certify contract safety.
How to provide liquidity more safely: before, during and after
The sequence below is a decision checklist, not a recommendation to deposit. Exact steps vary by version, network, token and interface.
Before connecting a wallet
- Name your objective. Is the goal market-making fee income, gradual conversion between assets, exposure to two tokens or speculation on a token? These are not the same.
- Write down starting inventories. Record exact token amounts and current prices, not merely a combined US dollar number.
- Verify the real site and chain. Use trusted official navigation, not an unsolicited advertisement or “claim rewards” link.
- Identify each contract. Confirm token addresses, pool version, fee tier, optional v4 hook and any strategy-vault manager.
- Test three market paths. A rise, a fall and a persistent depeg/asset failure; calculate hold-only values and possible liquidity composition.
- Estimate all costs. Approvals, deposit, fee collection, swaps, repositioning, withdrawal and potential taxes under applicable law.
- Confirm a real exit route. Check the chain, bridge dependence, underlying token liquidity and whether the position can be closed directly if the web interface fails.
When authorizing the liquidity deposit
A self-custody wallet is an important control point: users can choose whether to sign specific transactions and token spending authorizations. That does not mean every smart contract is trustworthy or that the wallet will calculate your LP returns. The Terenval guide to reviewing and revoking token approvals explains why a spending approval differs from an ordinary wallet connection.
Terenval Wallet context: Users considering decentralized finance benefit from understanding independent key custody, the selected blockchain and the limits of what the wallet can verify. Terenval Wallet is a self-custody wallet discussed here as an example of controlling transaction authorization; we do not claim that it includes a built-in Uniswap v2/v3/v4 liquidity interface, automated range rebalancing, impermanent-loss protection or support for every chain/token. Compatibility with any external DeFi workflow should be verified independently in the current app and protocol. A wallet is not an assurance of investment returns.
While the position remains open
Track current underlying token quantities, fees earned in each token, in-range status, pool and hook configuration changes, USD and HODL values, and available exit gas. Do not rely only on “profit” in a third-party dashboard if it omits uncollected fees, IL, protocol fees, rebalances or volatile incentives. Reevaluate your strategy when a token breaks its peg, governance updates material parameters or a security advisory affects a dependency.
When closing a position
Inspect the returned token mix, actual minimum amounts, fees to collect, network gas and any additional token swap needed to reach the desired allocation. After closing, review whether residual allowances should remain enabled and keep a transaction record. If exit is temporarily impossible, distinguish between a website outage, insufficient gas, pool liquidity, chain congestion and a true contract restriction; they require different responses.
For wallet recovery fundamentals, see Seed Phrase vs Private Key vs Wallet Password and Can You Use the Same Crypto Wallet in Two Apps?. Importing a wallet into another app does not itself withdraw tokens from a DeFi contract or alter LP economics.
Seven real-world-style scenarios: what a liquidity provider may experience
The following scenarios are invented for instruction; they do not represent observed pool histories or investment recommendations.
Scenario 1: ETH rallies 100% while the LP earns modest fees
A full-range $10,000 ETH/USDC pool under the standard assumptions reaches about $14,142 of inventory value while HODL reaches $15,000. If only $250 of net fees were earned, the LP finishes about $608 behind HODL before other adjustments. The LP investor made money in USD, but a passive investor with the same starting tokens would have done better. This is the classic reason a bullish long-term holder might hesitate to LP an ETH/stablecoin pair.
Scenario 2: ETH declines by 50% and the pool accumulates ETH
The fee-free LP inventory is worth approximately $7,071 while the same entry assets held untouched are worth $7,500. The AMM has bought more ETH as its relative price fell. If the user does not actually want additional ETH exposure after a drawdown, the LP strategy has created an allocation mismatch as well as an opportunity-cost shortfall. Fees might partly compensate, but cannot undo token price declines.
Scenario 3: ETH price returns to entry after a wild round trip
Under the ideal fee-free full-range formula, endpoint IL returns to zero if the relative price ratio returns to 1. That does not prove a real position earned a positive net return: arbitrage fees, favorable or unfavorable execution paths, protocol costs, rebalances and gas all occurred along the way. Conversely, meaningful fees might have been earned during the volatile round trip. A final-price-only IL calculator cannot predict the cash outcome of that path.
Scenario 4: A concentrated ETH/USDC position exits its upper range
A v3-like position with entry ETH $2,500 and the band $2,000-$3,000 converts toward USDC as ETH rises. Above $3,000, the modeled position is all USDC and stops earning new LP swap fees. If ETH then reaches $5,000, the LP holds about $10,431 of USDC in the teaching example while the exact entry tokens held privately would be worth about $14,521. The opportunity cost increases substantially even though the position is not liquidated.
Scenario 5: A stablecoin loses its peg
A USDC/other-stablecoin pool offers seemingly low price volatility until one asset falls sharply. Arbitrageurs may exchange the impaired token for the stronger one, leaving the LP with more of the impaired asset. The pool can suffer direct USD value loss, IL relative to hold and potentially failed redemption. Screening only the historical IL percentage would miss the dominant risk.
Scenario 6: High headline APR hides negative performance
A manager advertises a 70% annualized fee APR from a short, unusually active period. The position is frequently out of range, management fees apply, and the user pays gas each time the manager moves the range. After accounting for the actual fee tokens, deposits, HODL benchmark and costs, the investor may finish with a negative excess return. Without the complete LP Outcome Ledger, “70% APR” is not sufficient evidence to deposit.
Scenario 7: A v4 hook introduces a surprise
A pool uses a hook with configurable dynamic fees and external protocol calls. An investor models IL using a v3 calculator but overlooks unusual fee behavior and a dependency failure. The resulting problem is not simply “more IL”; it could be a contract or control-design risk outside the classic invariant. The official Uniswap hook security framework is a useful starting point, but each actual hook needs its own inspection and security due diligence.
Why it matters for Bitcoin, Ethereum, L2 networks, DeFi and wallets
Bitcoin: Standard BTC does not become a Uniswap ERC-20 pool token by itself. Exposure through wrapped or bridged BTC representations introduces custody, bridge or redemption risk on top of AMM inventory risk. A BTC-correlated pair can still diverge, especially if the representation breaks its peg.
Ethereum: ETH/USDC is an intuitive example because many crypto holders have a directional opinion on ETH. In a pool, a rising ETH price can lead to fewer ETH units held than in an untouched wallet. An ETH investor should compare token-unit ownership and USD performance rather than assume an APY boosts ETH accumulation.
Layer 2: Networks with lower transaction costs can make smaller LP positions more economically practical; that advantage must be weighed against sequencer, bridge, smart-contract and liquidity fragmentation risks. A low gas estimate does not make a volatile pool safe or validate the pool's token contracts.
DeFi lending: LP tokens or LP exposure can sometimes be pledged elsewhere as collateral or used by structured strategies. In that case, the investor can face both AMM divergence and a separate lending liquidation process. For the underlying borrowing mechanics and health-factor risks, read How DeFi Lending Works: Earn, Borrow & Avoid Liquidation. The products should not be treated as independent if a failure in one protocol affects the other.
Wallets: A wallet connects identity and approvals to on-chain activity, but the AMM holds the tokens or issues a position claim according to the pool design. A visible wallet balance is not a complete account statement of LP inventory, fees and opportunity costs. Always confirm the chain, spender contract and position manager before authorizing changes.
Frequently Asked Questions (FAQ)
1. What is impermanent loss in plain English?
It is the value a liquidity provider gives up relative to keeping the same original tokens untouched because an automated pool rebalances the token mix as prices move. It does not automatically mean a loss against the original dollar deposit.
2. Why do liquidity providers experience impermanent loss?
An AMM buys and sells tokens through its pricing curve. Arbitrage and other swaps change pool inventories as market prices shift. The provider therefore owns fewer units of the outperforming token and more units of the underperforming token than a buy-and-hold investor would own.
3. Is impermanent loss a real loss?
It is a real economic opportunity cost relative to a well-defined alternative. It is not automatically a realized fiat loss. Closing the LP locks in the current token inventory and comparative result for that position; subsequent price movements do not undo the closed trade.
4. Does impermanent loss disappear if the price returns?
For the ideal fee-free, full-range constant-product model, IL relative to entry-token HODL returns to zero when the relative price ratio returns to the entry ratio. In real portfolios, fees, costs, rebalances, token failures and previous withdrawals can still make the final economic outcome different.
5. How do you calculate impermanent loss?
For the standard 50/50 constant-product model without fees, set r to the token price ratio at exit divided by its value at entry, then calculate 2 × sqrt(r)/(1+r) − 1. Multiply by 100 to express the result as a percentage relative to HODL. Use position-specific math for concentrated ranges or custom curves.
6. What is the impermanent loss if a token doubles in price?
Under the simplified full-range 50/50 constant-product model, a doubling of relative price gives approximately −5.72% of hold-only value, not −5.72% of the starting principal. For a $10,000 ETH/USDC example with ETH doubling, the shortfall is approximately $857.86 versus $15,000 held.
7. Is the impermanent loss the same for a 50% price fall?
For the classic formula, a halving and a doubling produce the same percentage IL (about −5.72%). Their dollar differences are not equal if the hold-only portfolio has different endpoint values. A price halving yields about a $429.00 shortfall in our $10,000 example.
8. Can liquidity providers earn fees and still lose compared with HODL?
Yes. If dollar divergence is $857.86, earned fees $650 and incremental costs $55, the LP remains about $262.86 behind holding the original tokens, even though the position could still be above its original principal.
9. Can trading fees fully offset impermanent loss?
Yes, in some periods and configurations, but they are variable and do not guarantee that outcome. Compare realizable fees earned by that specific position with its actual divergence shortfall, LP-specific costs and the correct reference portfolio over the same dates.
10. Is impermanent loss the same as a pool losing value in US dollars?
No. A pool can appreciate and still underperform HODL, or depreciate in dollars and outperform a different strategy. Relative IL is one measurement; absolute P&L is another. State both rather than treating them as synonyms.
11. Which token pairs have the least impermanent loss?
Pairs whose relative market price remains stable tend to create less classic divergence over the observed period, all else equal. But stablecoins can depeg, wrapped tokens can lose redemption value, and correlated assets can diverge. Small past IL is not a guarantee of small future loss.
12. Is a USDC/USDT liquidity pool risk-free?
No. Issuer, banking, depeg, liquidity, smart-contract and governance risks remain. A depegging token can become the larger part of the pool's inventory. The difference versus HODL may be small while both positions suffer absolute dollar losses.
13. Does Uniswap v3 have more impermanent loss than v2?
Concentrated positions can experience more severe divergence relative to holding than a full-range position over many price moves, but the outcome depends on the chosen range and entry inventory. They may also earn more fees while active. Compare exact configurations rather than assuming one version universally wins.
14. What happens when a Uniswap v3 position goes out of range?
In an ordinary concentrated position, it becomes one-sided and stops earning new LP swap fees until the price returns inside the range. The position is not automatically liquidated merely for being outside its band.
15. Can you lose all your money from impermanent loss alone?
The classic formula describes relative underperformance, not an independent exploit. If an underlying token becomes nearly worthless, the position can lose most of its absolute value, but the token collapse and smart-contract risks must be distinguished from IL. Extreme loss scenarios should not be minimized as “just temporary IL.”
16. Do full-range LP positions ever stop earning fees?
A normal full-range position does not hit a chosen price-range boundary, but fee earning still depends on swap demand, applicable protocol rules and actual active liquidity. Low volume can mean negligible fees, and contract or network problems can stop normal operation.
17. Do Uniswap v3 and v4 fees compound automatically?
No, not in an ordinary direct position. Accrued fees are accounted for separately and usually must be collected or reinvested by an action or manager. Any vault promising automatic compounding adds specific contract and management rules that should be examined.
18. What is the difference between IL and loss-versus-rebalancing (LVR)?
Conventional IL compares the ending LP value with keeping the initial tokens. LVR compares LP outcomes with a continuously rebalanced reference strategy along the trading path. Both concern market-making economics but use different benchmarks, so casually summing them can double-count risk.
19. How can I estimate LP break-even fees?
Calculate the current or hypothetical dollar gap between HODL and the fee-free LP inventory, add incremental position costs and subtract other realizable benefits. In the doubling-ETH teaching example, about $912.86 of fees are needed to offset $857.86 divergence plus $55 costs.
20. Why can a 100% APR liquidity farm still lose money?
Quoted APR may use a brief annualized window, assume active time, include volatile incentives or ignore gas, management and divergence costs. The position might become one-sided or fail before a year passes. Evaluate an auditable net return relative to the intended benchmark.
21. Does a high volume-to-TVL ratio guarantee good LP returns?
No. Total volume is not the position's fee allocation; active-liquidity competition, fee splits, market volatility, adverse selection and costs matter. Volume generated by distressed trading or manipulation can be economically different from ordinary recurring swaps.
22. Should I rebalance every time my liquidity range is breached?
Not automatically. Rebalancing opens a different inventory exposure, usually incurs execution costs and can lead to buying high or selling low. Compare deliberate hold, move, partial exit and full exit choices against the position's original purpose.
23. What is the safest liquidity-pool price range?
There is no universally safe band. Wider ranges may remain active longer but often capture less fee density per dollar of capital; tighter ranges may raise fee efficiency while increasing inactivity and one-sided conversion risk. The answer depends on tokens, market view, fee structure and costs.
24. Are Uniswap v4 hooks safe for liquidity providers?
They can be useful but introduce pool-specific code and potentially custom accounting, dynamic fees, oracle dependencies or external calls. Review the exact hook and its permissions, controls and security work. Being in a v4 pool does not certify its hook or guarantee its performance.
25. Does liquidity mining protect against impermanent loss?
Additional rewards may compensate economically, but token emissions can decline or become illiquid. Rewards do not change the underlying AMM inventory mathematics, eliminate exploits or guarantee a profitable exit.
26. Is impermanent loss the same as liquidation in DeFi lending?
No. IL is relative LP underperformance. Liquidation is a collateral-enforcement process in a borrowing protocol when its rules are breached. A leveraged LP strategy can face both risks simultaneously, which should be modeled separately.
27. Do Layer 2 liquidity pools avoid impermanent loss?
No. Lower fees may improve the economics of entering and managing a small position but do not change the underlying relative price movements. L2s can also introduce bridge, sequencer, liquidity and deployment-specific risks.
28. Do I need to approve tokens before adding liquidity?
For many ERC-20 workflows, a spending approval or signature-based authorization is required, followed by deposit operations. Verify the spender and allowance. A basic wallet connection is not an approval; granting unlimited spending rights without review creates a separate attack surface.
29. Can I manage an LP position using Terenval Wallet?
This guide does not claim Terenval Wallet has a built-in Uniswap LP interface or supports every contract or network. Verify any external integration and current network/asset support independently. Terenval is mentioned as part of a general self-custody and transaction-review discussion, not an assertion of integrated LP tooling.
30. What one calculation should I do before providing liquidity?
Write down the exact entry token quantities, model a realistic adverse relative-price move, calculate what holding those same tokens would be worth, and compare it with the estimated LP inventory plus realizable fees minus all costs. Then repeat for a depeg or contract-failure scenario, where the basic formula no longer captures the largest risk.
Related Terenval Reading
- How DeFi Lending Works: Earn, Borrow & Avoid Liquidation — understand variable borrowing costs, Health Factor and liquidation, which are not interchangeable with AMM divergence.
- How to Check and Revoke Token Approvals in a Crypto Wallet — understand spender permissions before interacting with an LP manager or strategy vault.
- Crypto Address Poisoning: How to Spot Fake Wallet Addresses — avoid copying deceptive destination addresses from a history feed.
- How to Choose the Correct Network When Withdrawing Crypto From an Exchange — cross-chain transfers and pool deposits require exact chain and token matching.
- Can You Use the Same Crypto Wallet in Two Apps? — understand portability without assuming two wallet interfaces support the same contract workflows.
- Seed Phrase vs Private Key vs Wallet Password — distinguish signing credentials from assets held by a smart contract.
Sources and Research Notes
This guide prioritizes primary technical and product documentation over yield-leaderboards, anonymous APR snapshots or unsourced forum claims. The cited sources support Uniswap's AMM rules, fee distribution, range behavior and hook architecture. They do not independently verify the hypothetical return numbers in this article; those are calculated from explicitly stated inputs.
- Uniswap Developers — Understanding Returns. Full-range impermanent-loss formula and underlying return comparison.
- Uniswap Support — What Is Impermanent Loss?. Product explanation of the mechanism and changing relative prices.
- Uniswap Labs — Understanding Liquidity Provision in DeFi. Fee sources, token pair selection and v2/v3/v4 range concepts.
- Uniswap Developers — Liquidity Overview. Position lifecycle, fees and out-of-range behavior.
- Uniswap Developers — Concentrated Liquidity. Price-bounded liquidity and capital efficiency.
- Uniswap Support — Risks When Providing Liquidity. IL, out-of-range, smart-contract and token risks.
- Uniswap Support — Does Out of Range Mean Liquidation?. Why standard out-of-range positions are inactive and single-sided rather than liquidated.
- Uniswap Developers — Fees Across Protocol Versions. Fee splits, LP accrual, v2 protocol fee configuration, v3 tiers and v4 dynamic fees.
- Uniswap Support — Fee Tiers. Version-specific fee tier behavior.
- Uniswap Developers — Understanding v4 Hooks. Optional pool customization.
- Uniswap Developers — v4 Hooks Reference. Hook contract lifecycle and pool-specific execution.
- Uniswap Developers — v4 Hook Security Framework. New security risks from accounting, external calls and programmable fees.
- Uniswap Labs — Passive LP Fee Returns Research. Historical research separating fee return from price exposure.
- Uniswap Developers — Protocol Glossary. Definitions of IL, pool ranges and AMM concepts.
- Uniswap Support — Protocol Version Liquidity Workflows. Adding and removing liquidity and collecting fees by version.
- Uniswap Support — Liquidity Provider Fees. Position fees and applicable current protocol fee shares.
Editorial Methodology, Calculation Assumptions and Disclosure
Information cutoff: November 5, 2026. AMM design and version-specific risk descriptions are grounded in the official documentation cited above. DeFi products, contract addresses, protocols, hook configurations, fee shares and incentive structures may change. Before acting, independently confirm the current market and contract facts. This is a durable educational comparison, not a live pool list.
Formula assumptions: The widely used IL formula assumes a full-range 50/50 constant-product market maker without swap fees, token taxes, leverage, rebasing balances, stable-swap curves or external contract exposures. The main $10,000 case begins with exactly 2 ETH at $2,500 each and 5,000 USDC at $1 each. All ending values use the same market price and assume the LP share is sufficiently small not to change price formation. The illustrated fees of $650 or $1,000 and costs of $55 are hypothetical and counted only where stated. Rounded table values may differ by a cent from calculations using full precision.
Concentrated-liquidity assumptions: The v3/v4-style math uses standard fixed-bound concentrated liquidity with ETH as token0, USDC as token1 and P quoted in USDC per ETH, lower bound $2,000, upper bound $3,000, initial price $2,500 and initial position value $10,000. The opening inventory is 1.808577496 ETH and 5,478.556260 USDC. End values are calculated directly from the documented square-root-price inventory equations, without fees, slippage, gas, range reset, discretionary rebalancing or custom v4 hooks. Compare every value against the exact same entry units valued at the ending price.
Original editorial contribution: The LP Outcome Ledger, Fee Coverage Ratio, Range Survival Stress Test and Rebalance Decision Compass are independently developed educational models to make investor comparisons and risk disclosures clearer. They are not on-chain risk engines, standard Uniswap metrics or product functions. Their thresholds and worksheets are not recommendations for any individual situation.
Advertising and product boundary: Terenval News/Answers is part of the Terenval ecosystem. Terenval Wallet is mentioned natively only to explain self-custody and transaction authorizations, without claiming direct Uniswap v2/v3/v4 integration, automated IL prevention, guaranteed yield, special insurance or third-party endorsement. This article contains no live deposit offer or affiliate APR ranking. It is educational information, not financial, tax or investment advice. LP positions can lose significant or all economic value through the underlying assets or protocol failures.